Monday, June 10, 2013

VHF Contest - Mt Diablo


For the 2013 June VHF Contest, I again traveled to Mt Diablo to set up a QRP station.  The equipment I used this year included the Yaesu FT-817ND transceiver, connected to three yagi antennas.  For six meters I used a new Diamond A-502HB short-boom two element yagi.  For the two meter band I used the 4-element Arrow VHF antenna, and for 70cm I used a Diamond A430-S15 15-element yagi.  All three antennas were attached to a Buddipole 18' telescoping mast, and the mast was guyed to the bed of my truck.  The antennas were spaced so that the entire array could be rotated by hand.  New this year was 223.5 MHz FM, using a Yaesu VX-6R radio and a an Arrow 220 1.25m 5-element yagi on a photo tripod.

The radios were running on solar power, via the 6.4Ah LiFePO4 battery and PowerFilm solar panels that I've used previously.  With the bright summer sunshine both days, there was no problem with the solar power keeping up withe the load from the radios.  Typical power output from the panels was around 5 to 10 watts -- I didn't need any more than that to keep the battery topped off.

The new antenna system seemed to work pretty well!  I started the contest Saturday around 1:30pm, on a very hot day (98F!) in the summit parking lot just below the Mt Diablo main summit.  The higher gain of the antennas (compared to the Elk and HO Loop from last year) seemed to help make it easier to contact the DX stations.  Running QRP, it was good to have the extra gain.

Along with me this year was Henrik KK6BQU (operating low-power nearby), and Gary KE6QR and Dave N6ORB were already set up in the same parking lot.  Activity was fairly heavy on Saturday, and at sunset Henrik and I packed up and headed back to the campsite at Juniper Campground.  As we were packing up, the Mt Diablo Astronomy Club was setting up quite a few telescopes in the parking lot -- a number of them had questions about what were were doing with all the antennas!

Sunday was more contesting, starting around 9am and continuing to the contest end at 8pm.  Overall, preliminary totals indicate 248 unique contacts on the four bands this year.  By band, I counted 90 QSOs and 25 grid squares on 6 meters, 80 and 12 on 2m, 21 and 6 on 1.25m, and 57 and 8 on 70cm.    There were sporadic E openings to the mountain states on Saturday, and into Canada and Alaska on Sunday. 

Highlights included making contact with N7NW in Washington on 6 meters (who I had contacted by EME two months ago), hearing W6PH operating from Lone Pine, CA (on the other side of the Sierra Nevada), hearing new stations in the contest for the first time, and working the contest regulars.  It was also nice to see Henrik enjoying his first VHF contest, and nice having the company up there!


Wednesday, June 5, 2013

EME and Antenna Patterns

I'm trying to further optimize my small EME station.  Based on the noise plots in the posts below, it's easy to see that raising the antennas to higher elevations will significantly decrease the radio noise that they "see" from the surrounding houses.  What I have noticed over the last six months or so is that by raising the antennas out of the noise (and pointing them slightly away from the moon), I can get significantly improved reception of EME signals.  This is because the main lobe of the antenna array is fairly broad, so even if the array is not pointed directly at the moon, there's still enough gain to receive signals.  Similarly, the steep sides of the main lobe help to selectively null out much of the surrounding terrestrial radio noise.


So, if the reception of moon signals at low moon elevations can be improved by pointing the antennas above the moon, does this have any negative effect on the transmission of signals to the moon?  If so, how much?  Is there a way to find out?

I have found that an easy way to test this is to call CQ, and monitor the reports of my received signal strength at a distant station.  The LiveCQ.eu site makes this relatively easy, as members of the MAP65 spotting network automatically upload signals that they have received from the moon.  In my case, station KB8RQ has a very good receive system and (when online) automatically will report my signal, in real-time, as it's received.  KB8RQ also has the advantage of using an adaptive-polarity dual-receive system, which helps to eliminate the effects of signal strength variability due to Faraday rotation.


By alternately raising and lowering the antennas every second CQ cycle, it's possible to do A/B comparisons between the two antenna angles.  There's a significant natural variation in signal strength on EME signals, but over time it seems possible to do some rough calculations as to whether one antenna elevation is significantly different from another.

My first test was to alternate a +0 degree elevation offset with a +7 degree elevation offset.  The offset is the number of degrees in elevation above the moon.  I was able to record received signals at KB8RQ over the period of about half an hour of calling CQ (with three brief interruptions as new inits from Hungary, Germany, and France replied to the CQ calls!).  Plotting the reported signal strength over time gave the following plot:


In the plot above I've recorded the signals received at the DX station.  The pink colored dots are the +7 degree elevation and the blue colored dots are +0 elevation.  From the plot, visually at least, there's not much difference between the two.  Both are highly variable and both are "about" the same.  Mathematically, it's possible to compare each cycle with its adjacent one, and see if it was "better" or "worse".  This is the value in the delta column, and with a mean delta of 0.31 dB and a standard deviation of 4.06 dB, the statistics confirm that there's no apparent difference in transmit signal between having the antennas pointed straight at the moon, versus pointed 7 degrees higher than the moon.

What about higher elevations?  Some draft antenna gain modelling of the M-squared (M2) 2M7 yagi antennas by W6YX suggests that it should be possible to raise the antennas 15 degrees above the target with only a -1dB penalty in signal.  The plot below shows the predicted gain of the 2M7 antenna in both the Horizontal (H) and vertical (V) planes:


My second test was therefore to alternate calling CQ at +0 and +15 degree elevations above the moon.  Results from this test are below.  


The second test indicates, again, a relatively small difference in transmit signal strength between having the antennas pointed at the moon versus raised 15 degrees above.  Mathematically, the pairwise comparisons indicate that elevating the antennas results in -1.6dB signals with a standard deviation of 3.2dB.  This actually fits very closely with the model predictions!

Subsequent tests the next day indicated similar results:
In the above plot, elevating the antennas 15 degrees above the moon causes a decrease in the received signal strength at the DX station of -1.7dB with a standard deviation of 2.7dB.  This fits nicely with predictions and the previous day's data.

In addition to KB8RQ, station S52LM in Slovenia was reporting signal strengths at the same time.  The S52LM station has less receive capability than KB8RQ so the signal strengths are lower:
This plot shows similar results to the last two:  relative received signal strength is down -1.7dB with the antennas elevated 15 degrees.  What is also of interest is that there are fewer total decodes with the elevated antennas (5 decodes at +15 degrees versus 8 decodes at +0 degrees).  This is probably a result of the slight signal loss pushing these (already marginal) signals past the limit of MAP65's Wide Graph detection (about -25dB).

Overall, what does this all mean?  Basically, it provides some early evidence that it's okay to aim the antennas well above the moon, in order to reduce the effects of the surrounding terrestrial noise and improve received signals, with little impact on the transmitted signal itself.

How much should the antennas be raised away from the moon in my situation?  It really depends on the moon's proximity to the surrounding terrestrial noise.  If the moon is at 20 degrees elevation, then raising the antennas +15 degrees will get them to a part of the sky with approx -3dB less noise, substantially increasing receive capability, with only an estimated -1.7 dB reduction in transmit signal strength.  If the moon is at 50 degrees in elevation (already in quiet sky), then there's no benefit to aiming the antennas off of the moon.  I haven't tested it yet, but based on the +7 degree tests, the calculated shape of the main lobe, and the fact that the +15 degree test shows a -1.7dB reduction, I suspect that a +10 degree elevation offset will not have a measurable impact on transmit signal strength.  My gut feeling is that using a "permanent" elevation offset of +10 degrees will allow me to take advantage of lower noise levels without any significant impact on TX signals.

(much thanks to W6YX for the M2 2M7 draft antenna plots!)

Wednesday, May 29, 2013

EME and Satellite Antenna Mount

Mike in Texas emailed me recently to ask about the construction of the antenna mount that I use with the Yaesu G-5500 rotator.  The mount allows for two 2m yagis to be used on the same az/el rotator as a 70cm yagi.  Here's an overall photo of the current antenna array:


And here are the construction details of the "bridge" mount:


The advantage of the bridge mount is that it lets me use the same array for V/U satellites, U/V sats, and 144 MHz EME.  The antennas (a M2 440-18 and two M2 2M7's) have more than enough gain for the current fleet of amateur satellites -- typically only 2.5 watts is necessary to work the sats.

I use a metallic crossboom so that I can use vertical polarization on the VHF antennas, and run the feedline along the crossboom without adverse interactions.  To keep the antennas low-profile (tucked in behind the roof corner of the house) I need to keep the feedlines from hanging off the rear of the array, therefore vertical polarization is suitable.

So far I haven't been able to detect any adverse interaction between the 70cm yagi and the two 2m yagis for EME operations.  The 70cm yagi is horizontally polarized, and placed roughly mid-way between the two 2m yagis which are installed as per manufacturer's specs for stacking.  With the two 7-element 2 meter yagis, I've been able to make around 130 EME QSO's with 100 unique stations in 25 countries over six months of operating.


Thursday, May 2, 2013

RF Heat Maps: How the EME Antennas "See" Local Noise


Some of the software applications in my regular business use "heat maps" to make complex data sets very easy to interpret.  In a heat map, the numerical value in a table is converted to a color -- blue = low numbers, green = higher, yellow = even higher, and red = highest.  Recently, I decided to try making "heat maps" of the RF noise environment that the antennas see, and it's led to some interesting results.

To collect the data, I simply sweep the antenna east to west, stopping in 22.5 degree increments.  When the antennas stop, I read the absolute RF noise measure in decibels (dB) from the MAP65 display.  The MAP65 software listens to the FUNcube Dongle Pro+ at 144.1 MHz.  At the end of every sweep (nine data collection points) I raise the antenna 10 degrees in elevation and sweep again.  After the 60-degree elevation sweep I have 63 data points; it takes around 5 minutes to collect all the data.  Once I have the set of dB noise levels, I enter that into Excel and use a custom-made Visual Basic script to color the cells in a heat map.


The heat maps give a picture of how much noise the antennas see in any given direction and elevation.  At the top of the maps (in blue) is the cold sky, and at the bottom of the maps (in red) is the hot suburban environment that I live in.  With a few maps collected so far, I can easily see the RF noise generated from my own office, television, as well as the neighbor's different televisions, a plasma TV across the street, and some odd source of noise maybe coming from a house in the southwest direction.


To put the noise levels in perspective:  at 24dB and below (green and blue) I can hear 4-yagi EME stations.  At 24-26dB I can only hear the larger stations.  And above 26dB I can only hear the EME super-stations.  Definitely, the best time for EME is when the antennas are pointed into a blue or green area of the sky!!

Is there any value to these plots?  Other than curiousity, I'm not sure yet.  One thing they should be useful for is comparing noise levels over time, to see if any new sources of noise appear, or if any existing sources disappear.  They can also help predict good EME operating times, based on the moon's path through the sky vs. the local RF noise seen by the antennas in the plots.

[Update 5/8/2013]
I've done a few more noise plots since this first post.  The image below shows three additional plots.  The first one shows typical evening (10pm) noise, and the middle one shows typical morning (6:30am) noise when local neighbor's TV's are mostly off:


The third plot is really interesting.  It was taken in early afternoon, as I was trying to determine why the background noise around the moon was so high.  I did a full plot, and could see a large area of noise fairly high up in the sky (around 60+ degrees elevation) in the South SouthWest.  A quick check of the astronomical data showed that the sun was in the exact center of this area of high noise!!

It was surprising to me that sun noise at 144 MHz ccould be that high (in this case, over 6 dB above the surrounding cold sky), but based on the figure above it's hard to draw any conclusion other than that the sun could be the source. (Also, 2 hours later, the noise source in the sky had shifted 40 degrees to the West, matching the movement of the sun....)   Following from this, some good information on solar noise levels is in the article located at:

http://www.vk3um.com/SunNoise_Measurements.pdf

In the above paper, the difference in sun noise compared to cold sky (in dB) is called the Y-factor.  From the table "Expected values of Sun Noise (Y-Factor)", for a 144 MHz antenna array such as mine (12.3 dBi * 2 - 2.1 = 13.3 dBd) I'd expect to see a Y-factor of roughly 2.5 dB at a typical minimum solar flux of 62 SFU.  The current reported solar flux (4pm 5/8/2013) is 127 SFU, so this should equate to an approximate Y-factor of 2.5dB * (127/62) = 6.5 dB.  What I observed today was an apparent Y-factor of 29.0 dB-22.4 dB = 6.6 dB, which almost exactly matches the expected Y-factor.

Translation of all this:  it seems that my antennas can see not only the RF noise coming out of the nearby houses, but also can see the RF noise coming from the sun itself.


Monday, April 15, 2013

A Few More EME Contacts on 144 MHz


This weekend was a good one for EME (earth-moon-earth) contacts with my small two-yagi station!  On Saturday I managed to make 19 EME contacts, 16 of which were stations I hadn't contacted before.  Almost all of the stations contacted were 4-yagi stations.

UA3PTW KO93 Russia
KB8RQ EM79 USA - Ohio
RT4I LO43 Russia
ES3RF KO29 Estonia
RA6A KN96 Russia
UY0LL KN79 Ukraine
G4ZFJ JO01 United Kingdom
DL1RNW JO62 Germany
DK4RC JO60 Germany
DK2PH JO41 Germany
DL9GS JO31 Germany
DL4KUG JO64 Germany
DJ9MG JO52 Germany
SP4KM KO03 Poland
CT1HZE IM57 Portugal
VE2JWH FN35 Canada - Quebec
N7NW CN87 USA - Washington
WA3QPX FM29 USA - Maryland
JR3REX PM94 Japan

One thing that helped to make contacts this weekend was the presence of a 2 meter EME DX-pedition on 144.134 MHz: station 9G5EME has set up portable operation in Ghana.  This brought out a lot of EME operators, so with more people watching the moon this weekend, there were simply more out there to make contact with.  Conditions for EME were also pretty good:  the moon's elevation is fairly high above the horizon, and the moon comes up early enough (late morning here in California) that the European stations are still awake and active.

Some screenshots of the contacts are below.  Going clockwise around the desktop, in the upper left is the MAP65 spectal display, showing activity on the entire EME band from 144.106 MHz to 144.166 MHz.  To the right is the MAP65 stations window, showing what stations have been heard by that software.  Right of that is the astronomical data window, showing the position of the moon for my station and the DX station.  Below that is the spectral display for WSJT9 software, displaying a high-resolution spectrum on the frequency I'm actually operating on.  To the left is the MAP65 main window, showing stations decoded.  And to the left of that is the WSJT9 window also showing stations decoded.  The MAP65 software listens to the FUNCube Dongle Pro+ software-defined radio (SDR), and the WSJT9 software listens to the FT-817ND analog radio.  By using two separate radios (one SDR, one analog) it's possible to view the entire band activity at once, and still have high-quality decodes.

Here's KB8RQ, a very large station with 24 yagis:


And ES3RF, a 4x18 yagi station:


And CT1HZE, a very strong station:


Finally, I've updated the EME station block diagram:


Tuesday, April 2, 2013

Satellite AO-07 Spectrum Plots

Following on the screenshots of satellite VO-52's downlink spectrum (previous post), here are some photos of what Oscar 7's downlink looks like when viewed with a software-defined radio (the FUNCube Dongle Pro+).  AO-07 was in Mode B (UHF up, VHF down) at the time.

This particular pass (4/2/2013 1315z) was North to South:


And I started taking the screenshots when AO-07 was already high in elevation towards the east.   You can see the three strong "noise" bands (145.926, 145.941, and 145.958 MHz) of the satellite within the transponder downlink (145.924-145.964 MHz):


In this photo, a station can be seen calling CQ at around 145.950 MHz.  It's interesting to see how the SSB transmission affects the three noise bands.  We hear how excessive uplink power can cause the transponder to start "FMing", and this is a mild example of how a transmission in one part of the passband can affect signals in another:


In the next frame, you can still see the SSB transmission at 145.950 MHz, but you can also see an interesting "glitch" that affected the whole passband for around 15 seconds:


Some sort of signal (rapidly increasing in frequency) was heard by the satellite in the next photo, and you can see how it disrupted the three noise bands as it went by.  This is possibly another example of how the whole transponder passband can be affected by a single signal.  The "offending" signal is the orange diagonal line:


As AO-07 continued south, it's signal started to become weaker.  You can see my SSB CQ calls at 145.949, followed by a call in CQ below:


As the satellite got lower, signals were weaker, but my SSB CQ calls were still clearly visible:


Eventually the satellite was just a degree above the southern horizon:


And even then my SSB CQ call and CW ID is visible in the spectral plot:


When Oscar 7 got to -0.6 degrees (below the horizon), the three "noise bands" are entirely gone, along with any trace of signal from my uplink:


Monday, April 1, 2013

Satellite VO-52 with the FUNCube Dongle ProPlus

Tonight I took some screenshots of the SDR (software-defined-radio) that I use during the U/V satellite passes.  Since the VHF receive line is split between the FT-817ND and the FUNCube Dongle Pro+, I can run both radios at once and see (visually)what the entire downlink passband looks like during the pass.

This makes it really easy to see who else is on the satellite.  Without having to tune the main radio, I can just watch the waterfall display to see what activity there is.  It's simple to identify CW stations, stations tuning up, and SSB transmissions.

Here's a radar plot of tonight's pass (AOS at 4/2/2013 02:42z):

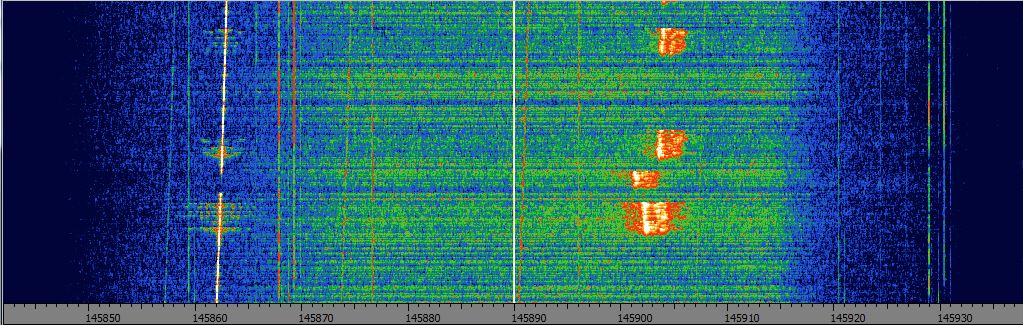
And here is the console display of the SDR program HDSDR.  Frequency control is in the lower left, the main waterfall is on the top, and the waterfall of decoded audio signals (a close-up of the main waterfall) is on the lower right.  The main waterfall covers from around 145.840 to 145.940 MHz.  The solid vertical traces are the local "birdies" coming from various sources of RFI in my area.  The waterfall flows from bottom to top, so the whole display is constantly "flowing" upwards.  Newest signals are at the bottom, and the vertical span of the waterfall covers around thirty seconds.

At the start of the satellite pass, the downlink is very quiet.  You can see my CW identification as a vertical streak around 145.905 MHz.  It's actually easy to identify, since it does not extend all the way from top to bottom like the birdies do.  VO-52 is only about 2 degrees above the horizon in the south at this point.
 

As the satellite gets up in elevation a few more degrees, you can now see me calling CQ in SSB around 145.905 MHz.  There's also a noise burst around 145.925 MHz.
The satellite is up around 10 degrees at this point, and my CQ calls in SSB are clearly visible:
Now that the satellite is around 25 degrees above the horizon, my CQ call in SSB (top) is followed by a CW ID (vertical line), and then another station answers my CQ but is slightly off frequency (about 3kHz below me).

It takes a little while for the other station and I to get lined up, you can see the patchy transmissions.  At this point the satellite is at a really high elevation and is moving pretty fast overhead, so doppler is playing a significant role.  The sloping vertical line on the left side of the waterfall is VO-52's CW beacon, slanted due to doppler shift.
We're now lined up, and have good strong signals.  You can clearly see the noise floor of VO-52's passband, it's the yellow-orange patch in the center of the waterfall from about 145.870 to 145.910 MHz:
As VO-52 continues north and descends towards the horizon, signals start to fade out:
Near the end of the pass, I spun the tuning dial as I was sending a string of dashes in CW, you can see the zig-zag pattern it makes.  This is typical of what a "tuner-upper" will look like on an SDR -- their CW will zig-zag through the passband until they (hopefully!) zero in on themselves:
As the satellite continued even lower towards the horizon (about 10 degrees by now), signals were pretty weak.  My SSB call is the smudge at around 145.903, and my CW ID's are the orange vertical lines below that.
This was a pretty quiet pass (only myself and one other station), but hopefully it will give you an idea of what a typical linear transponder satellite downlink "looks" like on an SDR display.